Gene Set Enrichment Analysis (GSEA) is a computational method that determines whether an a priori defined set of genes (gene sets) shows statistically significant, concordant differences between two biological conditions.
GSEA has two modes:
Classic mode (recommended): User will input normalized gene expression values as GCT/GMT files. This should include all or most (after removal of low signal genes) of the genes that were included in the experiment. GSEA ranks genes based on differences between conditions. Genes on the top part of the ranked list are over expressed in condition1 and genes on the bottom part of the ranked list are under expressed in condition2. GSEA will identify gene sets that are enriched (overrepresented) among the highest and lowest ranked genes as postively and negatively enriched gene sets respectively.
Pre-ranked mode: User will input a list of genes, already ranked by something like fold change or pvalue in RNK file format. This should include all or most (after removal of low signal genes) of the genes that were included in the experiment. Genes on the top part of the ranked list are over expressed in condition1 and genes on the bottom part of the ranked list are under expressed in condition2. GSEA will identify gene sets that are enriched (overrepresented) among the highest and lowest ranked genes as postively and negatively enriched gene sets respectively.
GSEA can be downloaded here.
Let's run GSEA in classic mode using these example files (file has been subset to include only 4000 genes to speed up the process).
Example gmt file genecounts.normalized.gct
Example phenotype file phenotype.cls
Example chip file annotation.chip
GSEA OUTPUT:
From GSEA documentation:
"The primary result of the gene set enrichment analysis is the enrichment score (ES), which reflects the degree to which a gene set is overrepresented at the top or bottom of a ranked list of genes. GSEA calculates the ES by walking down the ranked list of genes, increasing a running-sum statistic when a gene is in the gene set and decreasing it when it is not. The ES is the maximum deviation from zero encountered in walking the list. A positive ES indicates gene set enrichment at the top of the ranked list; a negative ES indicates gene set enrichment at the bottom of the ranked list."
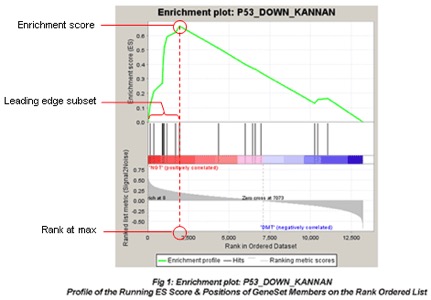
"The top portion of the plot shows the running ES for the gene set as the analysis walks down the ranked list. The score at the peak of the plot (the score furthest from 0.0) is the ES for the gene set. Gene sets with a distinct peak at the beginning (such as the one shown here) or end of the ranked list are generally the most interesting."
 at the University of Texas > Gene Set Enrichment Analysis (GSEA) > image-20250612-174126.png")
Consider using a volcano plot to visualize GSEA results.
 at the University of Texas > Gene Set Enrichment Analysis (GSEA) > image-20250612-174548.png")